I am encountering an issue I believe related to a memory leak in the server, but I couldn’t use pprof.
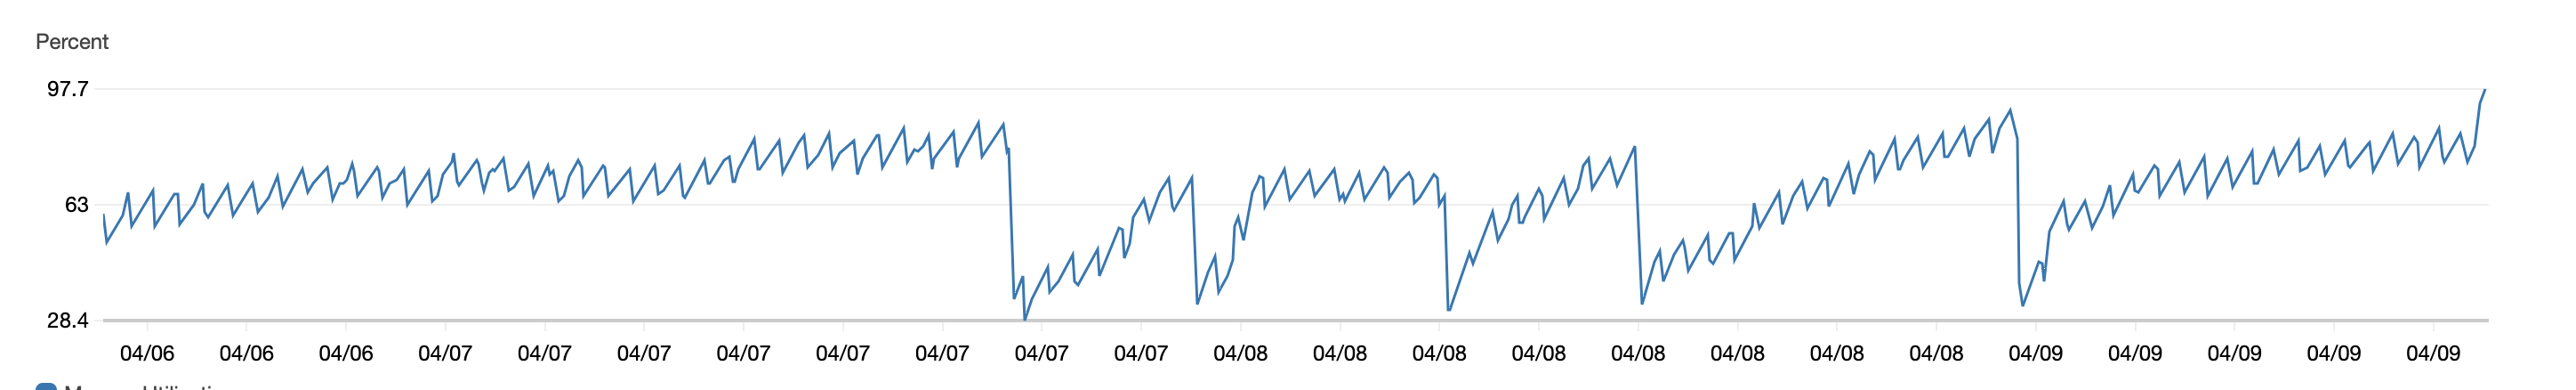
I am currently running the server on ECS (I am waiting for the new version of the managed cloud platform). and every few hours (6-12) the process reaches 100% memory utilization and failed to serve any new connection with a storage read error. I have checked the console to make sure that all the sessions and presences and matches are closed when completed and it seems ok, the only thing that seems to increase through the lifetime of the process is the amount of goroutine (I do not use any custom goroutines in my plugin). Because it’s very difficult to investigate this without pprof, I wonder maybe you familiar already with such behavior I attached the screenshot of the memory utilization for the last few days and the metrics from the console at the point when the server stops serving.
There are other resources that might increase but are not tracked by the status view. Your “storage read error” might be an indication that database resources are not correctly cleaned up for example. Do you have custom database queries that use the sql.DB handle in the Go runtime? If so are you closing the result sets correctly?
Also look for other resources in your code that might be increasing or not cleaned up. Typical culprits here are maps/slices of values that just grow, retaining references you may not need anymore and so on.
Thanks @zyro, So I have scanned the code for resources not correctly cleaned up. I have custom queries and also transactions but everything seems to handled correctly. The problem is that the same behavior was reproduced on a server that does not serve any connection. (one I have deployed for a test).
I spoke with @oshribin outside the forums about this issue and it appears to be with Elastic Container Service at AWS but its not clear what causes it. This is not an issue with Nakama and he will investigate further if needed.